
How to Calculate Engagement Rate on Instagram, TikTok and YouTube
Learn which engagement-rate formula to use on Instagram, TikTok and YouTube, why the denominator matters, and how to compare performance without misleading yourself.
 Sep 15, 2026
Engagement rate looks like a simple percentage.
It is not.
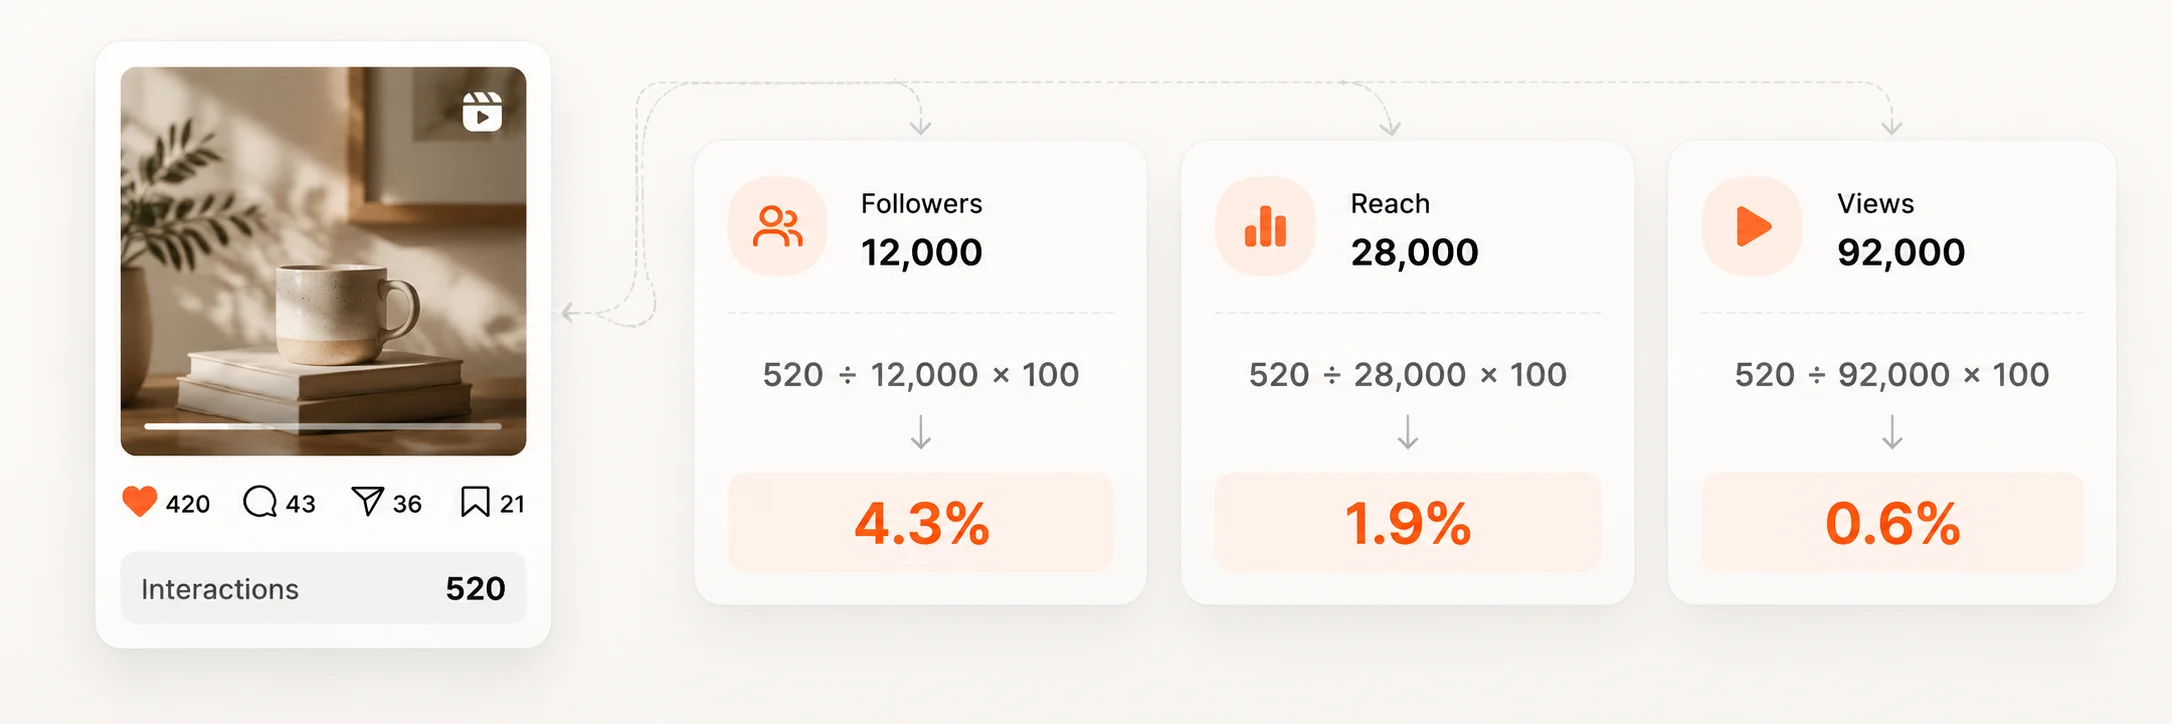
Two creators can publish the same post, get the same number of interactions and report completely different engagement rates. Both can be mathematically correct because they divided by different things.
Followers. Reach. Views. Engaged views.
So the useful question is not simply:
"What is my engagement rate?"
It is:
"Engagement rate relative to what?"
Once you understand the denominator, the metric becomes useful instead of decorative.
There is no single universal engagement-rate formula
Instagram, TikTok and YouTube give creators the raw ingredients: likes, comments, shares, saves, views, reach, watch time and other interaction data.
The percentage called "engagement rate" is usually a reporting layer built on top of those metrics.
Analytics companies do not all calculate it the same way. Socialinsider explicitly notes that tools can use different formulas. HypeAuditor, for example, has used view-based calculations for creator content while follower-based formulas remain common elsewhere.
Different formulas answer different questions.
| Formula | Calculation | What it tells you |
|---|---|---|
| By followers | Engagements ÷ Followers × 100 | Interaction relative to audience size |
| By reach | Engagements ÷ Reach × 100 | Interaction among people who actually saw the content |
| By views | Engagements ÷ Views × 100 | Interaction relative to content consumption |
A creator saying "my engagement rate is 6%" is giving you half the information.
Six percent of followers?
Six percent of reached accounts?
Six percent of views?
Those are different stories.
First decide what counts as an engagement
For a basic cross-platform calculation, the cleanest common numerator is usually:
likes + comments + shares
On Instagram, you can often include saves as well because they are part of the platform's interaction reporting.
Meta's current Instagram metrics distinguish between Accounts engaged, meaning people who interacted, and Interactions, meaning the actions those people took. One person can create several interactions.
TikTok Studio exposes post-performance metrics including likes, shares and views, while its engagement tools also provide comment analytics.
YouTube reports likes, comments and shares too, but video introduces an important complication: watching is itself a major form of engagement. YouTube's Engagement analytics emphasize watch time, average view duration and retention, not just reactions.
That is why one percentage can help compare posts, but it should not replace the native metrics that explain how people consumed them.
Instagram: followers give context, reach gives diagnosis
Suppose an Instagram creator has:
- 20,000 followers;
- 1,100 likes;
- 90 comments;
- 140 saves;
- 170 shares.
Total interactions:
1,100 + 90 + 140 + 170 = 1,500
By followers:
1,500 ÷ 20,000 × 100 = 7.5%
Now imagine the post reached 12,000 accounts.
By reach:
1,500 ÷ 12,000 × 100 = 12.5%
Both figures are correct.
They answer different questions.
Follower-based engagement tells you how much interaction the post generated relative to the creator's total audience size.
Reach-based engagement asks:
Of the people who actually received the content, how many interactions did it generate?
For your own Instagram analysis, reach is often more diagnostic because follower count does not tell you how many people saw a specific post.
For public creator research, however, you usually cannot see reach, saves or private Insights. That is why public calculators often fall back to visible likes and comments divided by followers or views.
If you calculate one creator by reach and another by followers, you are not comparing engagement rates. You are comparing two different metrics with the same name.
A practical Instagram rule
Use:
Interactions ÷ Reach × 100
when you have your own Insights and want to evaluate a post.
Use:
Visible interactions ÷ Followers × 100
when you need a consistent public denominator.
For Reels, a view-based calculation can also be useful when you specifically want to know how efficiently video consumption turned into interaction.
TikTok: views usually tell the cleaner story
TikTok is built around discovery.
A video can travel far beyond the creator's follower base, which makes follower count a weak denominator for individual-video performance.
Imagine a creator with 30,000 followers publishes a TikTok with:
- 80,000 views;
- 5,200 likes;
- 240 comments;
- 560 shares.
Total visible engagements:
6,000
By followers:
6,000 ÷ 30,000 × 100 = 20%
By views:
6,000 ÷ 80,000 × 100 = 7.5%
There is nothing wrong with the arithmetic in the 20% figure.
But it is easy to misread, because many viewers may never have followed the creator.
If the question is:
"How strongly did people who consumed this TikTok interact with it?"
then this is usually the more intuitive formula:
(likes + comments + shares) ÷ views × 100
Do not stop at the percentage.
A share carries a different signal from a like. Comments can reveal questions, disagreement, intent or curiosity. A video with an ordinary overall rate but unusually strong sharing may be strategically more valuable than the single percentage suggests.
YouTube: reactions are only part of engagement
You can calculate a YouTube social-action rate as:
(likes + comments + shares) ÷ views × 100
That can be useful.
It should not be mistaken for the whole picture.
YouTube's own Engagement analytics put significant emphasis on:
- watch time;
- average view duration;
- average percentage viewed;
- audience retention;
- engaged views.
A viewer who watches 18 minutes of a 20-minute video without clicking Like is still deeply engaged.
For long-form YouTube, retention and watch time often tell you more than a reaction rate.
Shorts require another layer of care
In August 2026, YouTube standardized its view definition so a view is counted when playback begins across Shorts, long-form video and live content. Its separate engaged views metric captures deeper viewing behavior, and YouTube says metrics such as average view duration and retention remain tied to engaged viewing.
So for Shorts, a useful report can show both:
Social action rate:
(likes + comments + shares) ÷ views × 100
and:
Attention metrics:
engaged views, stayed-to-watch, average view duration or average percentage viewed.
Sources: YouTube Help: Understand your YouTube engagement and YouTube: What are Engaged Views?.
For cross-platform short-form video, keep the denominator consistent
If you want to compare Instagram Reels, TikTok and YouTube Shorts, views can be a useful common denominator.
For example:
| Platform | Views | Likes | Comments | Shares | View-based engagement |
|---|---|---|---|---|---|
| Instagram Reel | 50,000 | 2,400 | 160 | 440 | 6.0% |
| TikTok | 90,000 | 4,300 | 210 | 890 | 6.0% |
| YouTube Short | 120,000 | 5,800 | 420 | 980 | 6.0% |
Each row uses:
(likes + comments + shares) ÷ views × 100
The identical 6% does not mean the three posts performed identically.
Instagram may have generated more saves. TikTok may have sent more people to the profile. YouTube may have held attention longer.
The common formula makes one dimension comparable.
The native analytics explain the rest.
Do not let one viral post define your baseline
Suppose your last five posts have engagement rates of:
3.1%, 3.4%, 3.6%, 3.8%, 18.9%
The arithmetic average is:
6.56%
But four out of five posts are below 4%.
The median is:
3.6%
For creators with occasional viral spikes, the median can describe normal performance better than the mean.
The same principle applies to the sample itself.
Compare similar content.
Do not casually mix:
- a giveaway with normal editorial content;
- a heavily boosted post with organic content;
- a YouTube Short with a 40-minute video;
- an old phase of your account with your current strategy.
A useful baseline answers:
"What does this creator usually deliver in this format under normal conditions?"
Be careful with "good engagement rate" benchmarks
Benchmark tables look objective. Their methodology often is not obvious.
A benchmark may be based on:
- brands rather than creators;
- followers rather than views;
- likes and comments only;
- a specific market or niche;
- one account-size range;
- one content format.
Those numbers are not interchangeable.
Socialinsider's current benchmark work, for example, analyzes large datasets of international brand pages using its own platform-specific methodology. That is useful market context, but it is not automatically the right target for an individual creator.
Source: Socialinsider: Social Media Benchmarks 2026.
Before using a benchmark, ask:
Who is in the sample? Which platform? Which format? Which account size? Which market? Which formula?
If you cannot answer those questions, treat the number as context, not a grade.
The Connekit method: put the methodology next to the percentage
Never present the rate alone.
Instead of:
Engagement rate: 5.8%
write:
Median Reel engagement by views: 5.8%
Formula: (likes + comments + shares + saves) ÷ views
Sample: last 10 organic Reels
Or:
TikTok view-based engagement: 7.2%
Formula: (likes + comments + shares) ÷ views
Sample: 4 campaign videos
Or, when only public data is available:
Instagram public engagement by followers: 3.4%
Formula: (likes + comments) ÷ followers
Sample: 12 recent feed posts
The percentage becomes more useful because the methodology travels with it.
A percentage is useful. A pattern is better.
One post can lie to you. Look across content, formats and campaigns so you can see what your audience repeatedly responds to, not just what happened once.
Explore ConnekitFrequently asked questions
What is the engagement-rate formula?
There is no single universal formula. The most common versions divide engagements by followers, reach or views and multiply by 100. The right denominator depends on the question you are trying to answer.
What counts as engagement on Instagram?
Instagram interactions can include likes, comments, saves and shares. Profile activity, follows and link behavior are usually more useful when tracked separately rather than folded into one generic rate.
How should I calculate TikTok engagement rate?
For individual TikTok videos, a practical formula is:
(likes + comments + shares) ÷ views × 100
A follower-based rate can still help with account-level comparisons, but TikTok distribution commonly extends beyond followers.
What is the best engagement-rate formula for YouTube?
If you want a social-action rate, use:
(likes + comments + shares) ÷ views × 100
But watch time, average view duration, average percentage viewed and retention often reveal more about YouTube audience engagement than reactions alone.
Should I use followers or reach on Instagram?
Use reach when you have access to your own Insights and want to evaluate how people who actually saw the post responded. Use followers when you need a consistent public denominator and do not have reach data.
Can I compare engagement rates across Instagram, TikTok and YouTube?
Yes, if you use the same numerator and denominator. A view-based formula can make short-form video easier to compare, but platform-specific signals such as saves, watch time and retention should still be analyzed separately.
An engagement rate is not a verdict on your content.
It is a ratio.
Its value comes from knowing what you counted, what you divided by, which posts you included and what question you were trying to answer.
Do that consistently and the number stops being vanity reporting.
It becomes a tool for deciding what to create next.
Your creator presence deserves more than scattered links.
Centralize your brand, your content and your opportunities with Connekit.
Get started